Construction Analytics & Reporting for Smarter Equipment Management


Reporting, Analytics and Answers for Construction Equipment Management
Equipment management data generates valuable information you need to monitor, operate and maintain your fleet. But what good is your data if you can’t easily digest and leverage it?
Tenna’s construction analytics and reporting tools are a powerful component of Tenna’s equipment management system. Tenna eliminates the common headache of compiling disjointed equipment management data and the time-intensive process of hunting and pecking data for actionable information.
Analyze and report out from the platform where your mixed fleet data is stored.
- Quickly look up and extract data on your performance and records to capture actionable insights.
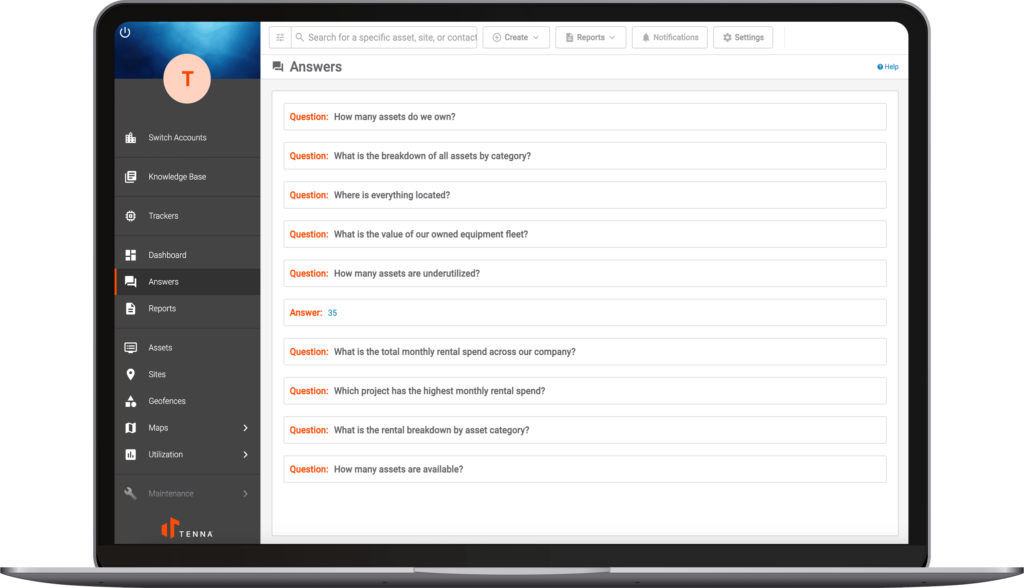
- View quick answers to relevant questions from the Answers feature.
- See high-level metrics most applicable to your role from your Dashboard.
- Build your own reports or leverage our pre-built construction reports in Tenna’s Reporting Engine to pinpoint the information you’re looking for.
Benefits of Construction Analytics and Reporting
Get time back from collecting and aggregating data from disparate sources.
Increase visibility into equipment performance and asset conditions.
Improve communication between office, shop and field with a single source of truth.
Make smarter decisions and forecasting with access to timely data.
Leveraging Tenna’s construction analytics and reporting, Boudreau Pipeline estimates savings between $15,000 to $19,000 per month.
Tenna’s Report-Building Engine and Construction Reports
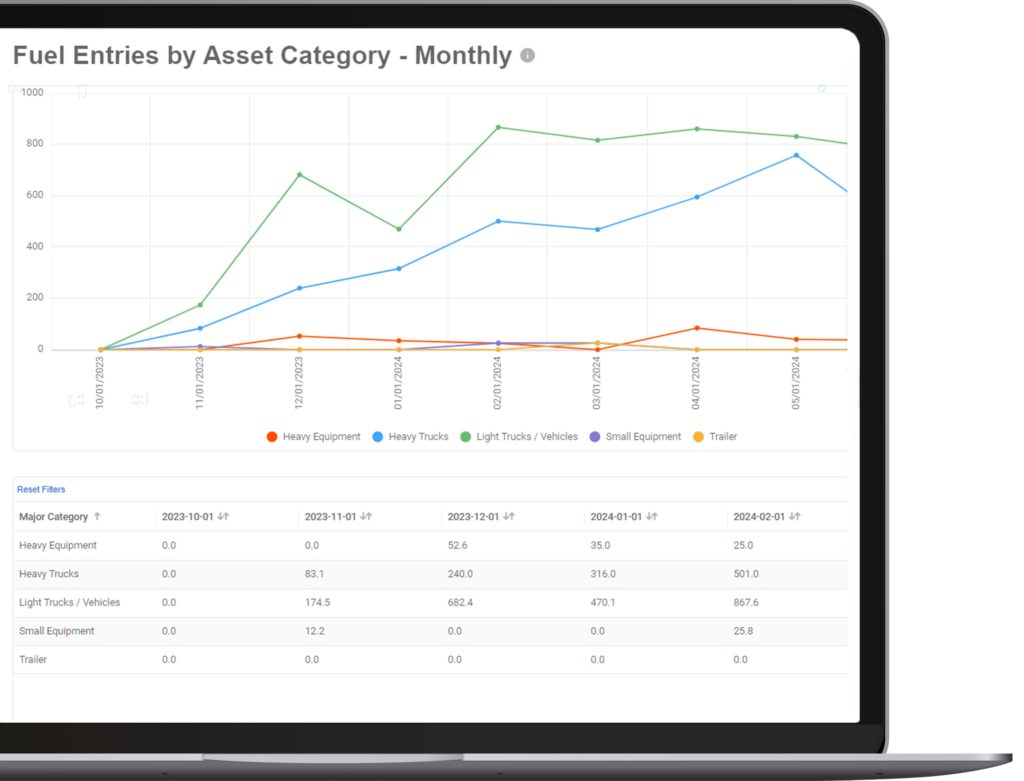
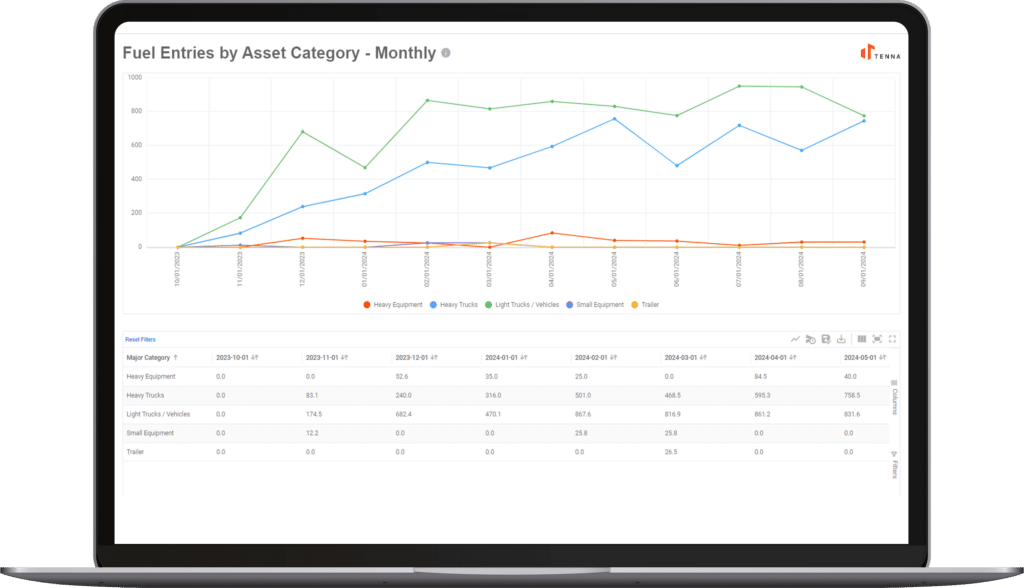
Tenna’s reporting engine is a construction analytics tool that boasts configurable report building capabilities and data visualizations. These data visualizations break down your construction equipment management data into highly visual charts, graphs and tables for easy analysis and actionable intelligence about your equipment fleet finances and operations. By leveraging this data, construction businesses can enhance their intelligence capabilities, identify trends, and make informed decisions that optimize performance, reduce costs, and drive strategic growth.
Users can:
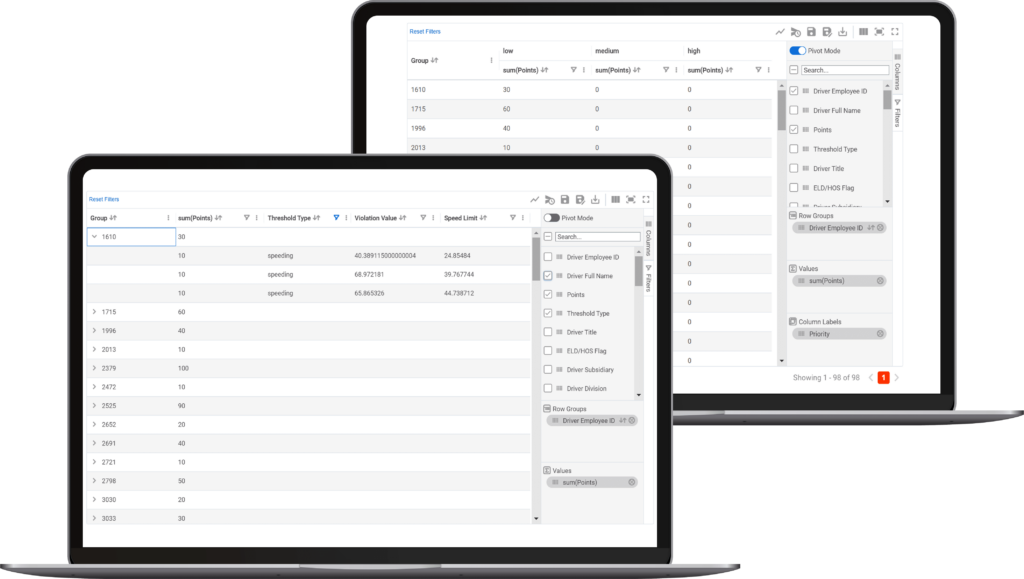
- filter, sort and configure reports to drill into the precise data their business needs,
- manipulate visualizations in a variety of ways to suit their analysis,
- scale reports with operations, or
- leverage Tenna’s standard reports library.

Tenna Provides Robust and Flexible Standard Reports
Owned & Rental Asset Details
Performance
Fuel Use & Consumption
Location History Request
"The biggest value for me is Tenna’s reports. I pull geofence enter and exit reports, and that helps me tremendously with invoicing, being more productive, and being more efficient and accurate on billing our customers."
Stay Connected for More

Premium Add-on for Construction Businesses: Asset Activity Reports
Travel Summary Report
Starts and Stops Report
Get Answers to Your Equipment Management Questions
Tenna’s Answers gives you fast, straightforward live construction data for topics that are top of mind.
- Executives want high-level data on what’s impacting the bottom line.
- Equipment Managers want quick info on what needs maintenance, and which equipment needs to go where and when.
- Superintendents want to know what’s available onsite or in the yard to execute their scopes.

Frequently Asked Questions
Real-time data analytics is critical for construction businesses to make quick, informed, on-site decisions.
Tenna Reports Product Overview
See Tenna in Action
Book a Demo

